signal strength 3 of 5

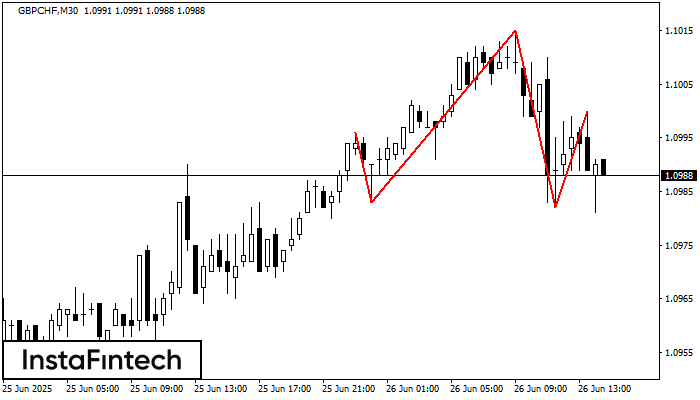
The GBPCHF M30 formed the Head and Shoulders pattern with the following features: The Head’s top is at 1.1015, the Neckline and the upward angle are at 1.0983/1.0982. The formation of this pattern can bring about changes in the current trend from bullish to bearish. In case the pattern triggers the expected changes, the price of GBPCHF will go towards 1.0952.
Vea asimismo
- All
- Double Top
- Flag
- Head and Shoulders
- Pennant
- Rectangle
- Triangle
- Triple top
- All
- #AAPL
- #AMZN
- #Bitcoin
- #EBAY
- #FB
- #GOOG
- #INTC
- #KO
- #MA
- #MCD
- #MSFT
- #NTDOY
- #PEP
- #TSLA
- #TWTR
- AUDCAD
- AUDCHF
- AUDJPY
- AUDUSD
- EURCAD
- EURCHF
- EURGBP
- EURJPY
- EURNZD
- EURRUB
- EURUSD
- GBPAUD
- GBPCHF
- GBPJPY
- GBPUSD
- GOLD
- NZDCAD
- NZDCHF
- NZDJPY
- NZDUSD
- SILVER
- USDCAD
- USDCHF
- USDJPY
- USDRUB
- All
- M5
- M15
- M30
- H1
- D1
- All
- Buy
- Sale
- All
- 1
- 2
- 3
- 4
- 5
Según el gráfico de M5, el AUDCHF formó el patrón Triángulo Simétrico Alcista. El límite inferior del patrón toca las coordenadas 0.5233/0.5245 donde el límite superior cruza 0.5254/0.5245
Los marcos de tiempo M5 y M15 pueden tener más puntos de entrada falsos.
Open chart in a new windowSegún el gráfico de M5, GBPCHF formó el Rectángulo Bajista que es un patrón de la continuación de una tendencia. El patrón está contenido dentro de los siguientes límites: límite
Los marcos de tiempo M5 y M15 pueden tener más puntos de entrada falsos.
Open chart in a new windowSegún el gráfico de M30, el AUDCHF formó el patrón Triángulo Simétrico Bajista. Recomendaciones de negociación: es posible que una ruptura del límite inferior 0.5229 fomente una continuación
Open chart in a new window