Actual patterns
Patterns are graphical models which are formed in the chart by the price. According to one of the technical analysis postulates, history (price movement) repeats itself. It means that the price movements are often similar in the same situations which makes it possible to predict the further development of the situation with a high probability.
Actual Patterns
- All
- Double Top
- Flag
- Head and Shoulders
- Pennant
- Rectangle
- Triangle
- Triple top
- All
- #AAPL
- #AMZN
- #Bitcoin
- #EBAY
- #FB
- #GOOG
- #INTC
- #KO
- #MA
- #MCD
- #MSFT
- #NTDOY
- #PEP
- #TSLA
- #TWTR
- AUDCAD
- AUDCHF
- AUDJPY
- AUDUSD
- EURCAD
- EURCHF
- EURGBP
- EURJPY
- EURNZD
- EURRUB
- EURUSD
- GBPAUD
- GBPCHF
- GBPJPY
- GBPUSD
- GOLD
- NZDCAD
- NZDCHF
- NZDJPY
- NZDUSD
- SILVER
- USDCAD
- USDCHF
- USDJPY
- USDRUB
- All
- M5
- M15
- M30
- H1
- D1
- All
- Buy
- Sale
- All
- 1
- 2
- 3
- 4
- 5
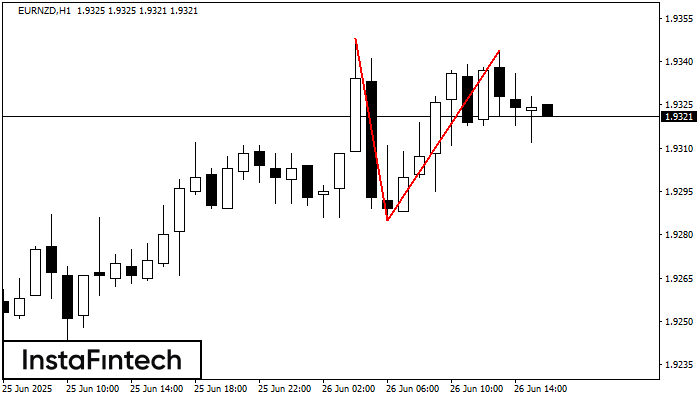
The Double Top pattern has been formed on EURNZD H1. It signals that the trend has been changed from upwards to downwards. Probably, if the base of the pattern 1.9285
Open chart in a new window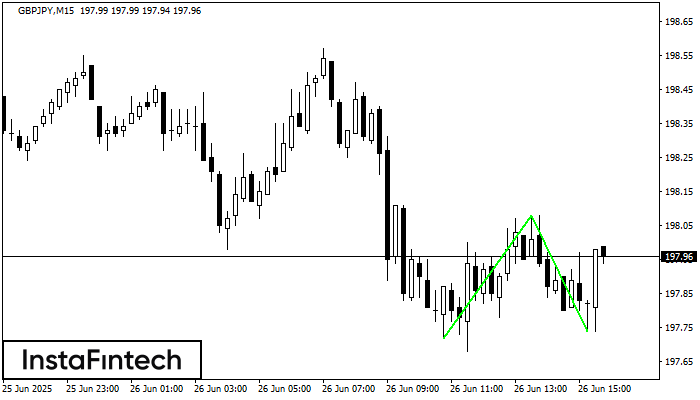
The Double Bottom pattern has been formed on GBPJPY M15. This formation signals a reversal of the trend from downwards to upwards. The signal is that a buy trade should
The M5 and M15 time frames may have more false entry points.
Open chart in a new window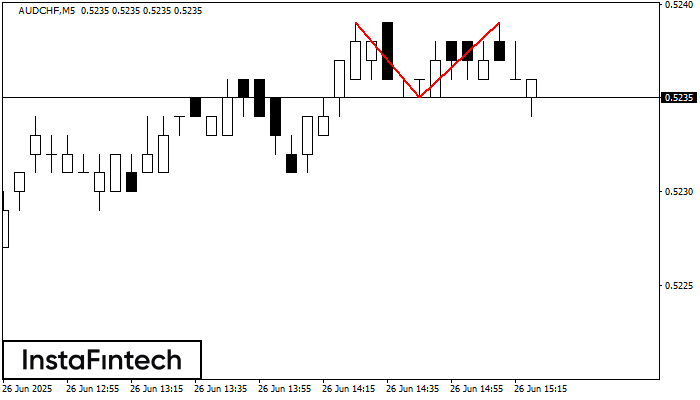
The Double Top pattern has been formed on AUDCHF M5. It signals that the trend has been changed from upwards to downwards. Probably, if the base of the pattern 0.5235
The M5 and M15 time frames may have more false entry points.
Open chart in a new window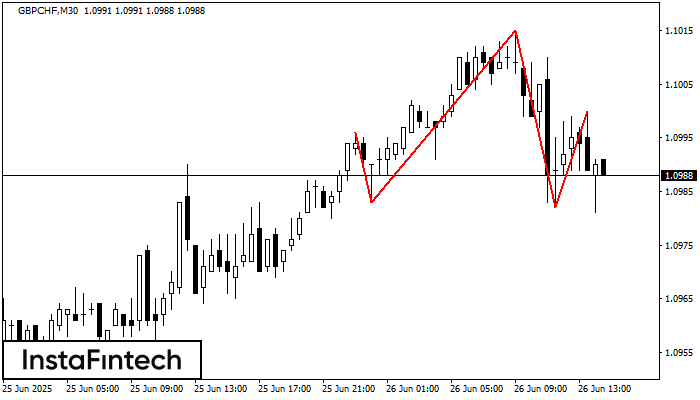
The GBPCHF M30 formed the Head and Shoulders pattern with the following features: The Head’s top is at 1.1015, the Neckline and the upward angle are at 1.0983/1.0982. The formation
Open chart in a new window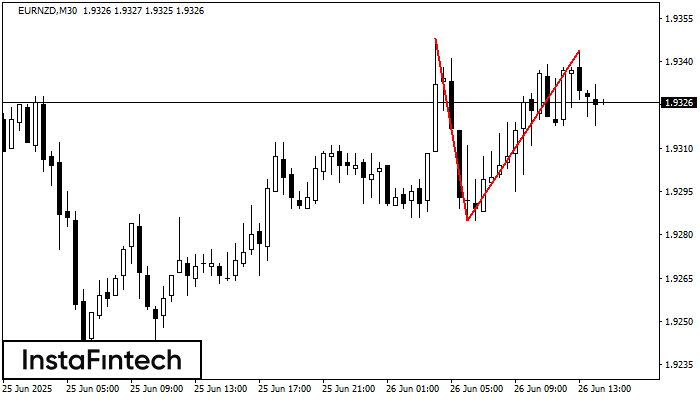
On the chart of EURNZD M30 the Double Top reversal pattern has been formed. Characteristics: the upper boundary 1.9344; the lower boundary 1.9285; the width of the pattern 59 points
Open chart in a new window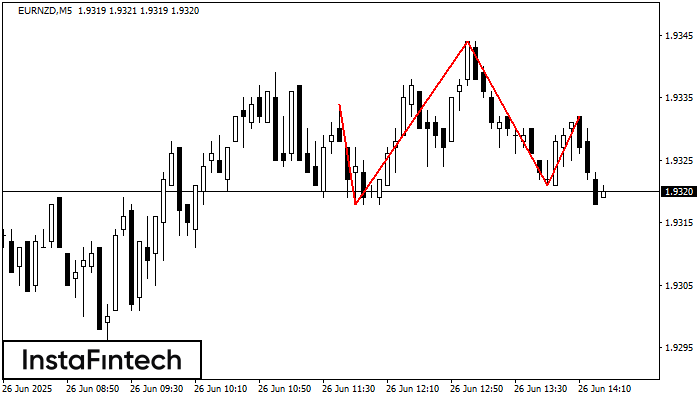
The technical pattern called Head and Shoulders has appeared on the chart of EURNZD M5. There are weighty reasons to suggest that the price will surpass the Neckline 1.9318/1.9321 after
The M5 and M15 time frames may have more false entry points.
Open chart in a new window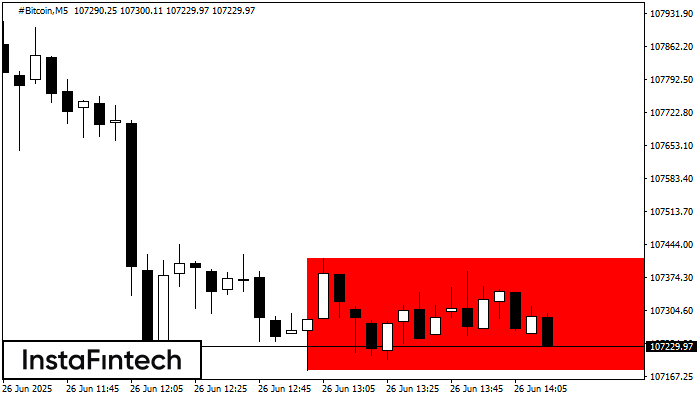
According to the chart of M5, #Bitcoin formed the Bearish Rectangle. The pattern indicates a trend continuation. The upper border is 107414.37, the lower border is 107179.50. The signal means
The M5 and M15 time frames may have more false entry points.
Open chart in a new window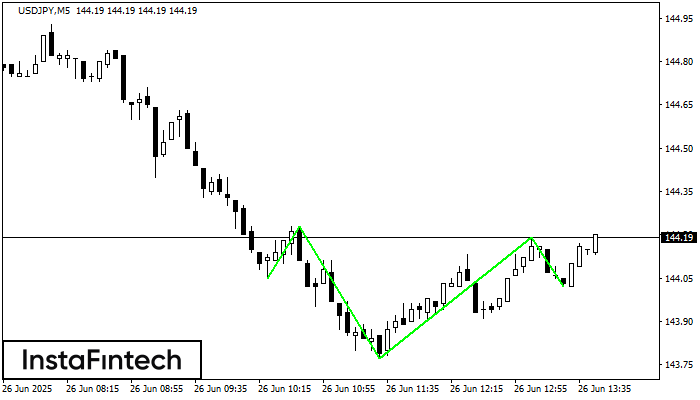
According to the chart of M5, USDJPY formed the Inverse Head and Shoulder pattern. The Head’s top is set at 144.19 while the median line of the Neck is found
The M5 and M15 time frames may have more false entry points.
Open chart in a new window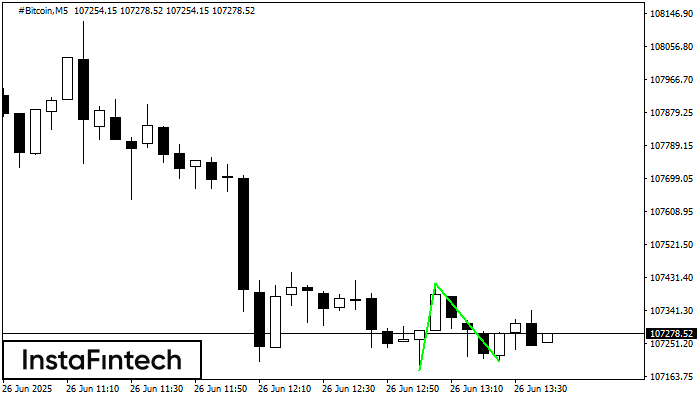
The Double Bottom pattern has been formed on #Bitcoin M5; the upper boundary is 107414.37; the lower boundary is 107202.27. The width of the pattern is 23487 points. In case
The M5 and M15 time frames may have more false entry points.
Open chart in a new window