empty
30.05.2025 01:27 PM
EUR/USD: Trading Plan for the U.S. Session on May 30th (Morning Review)

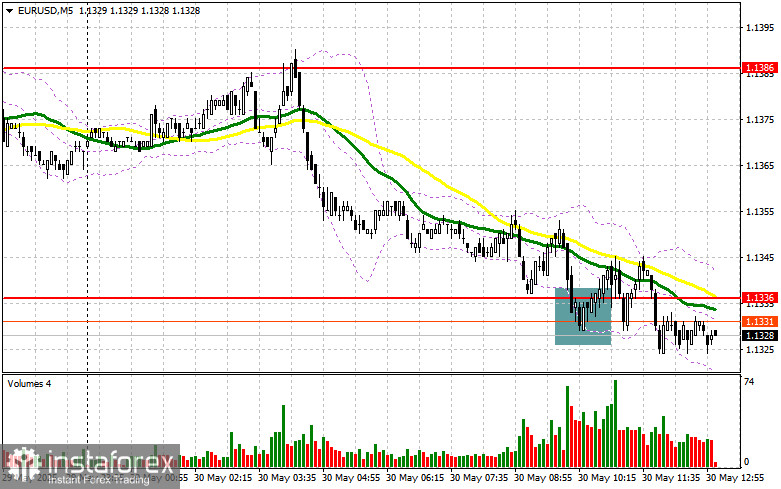
In my morning forecast, I focused on the 1.1336 level and planned to make market entry decisions from there. Let's look at the 5-minute chart and see what happened. A decline and the formation of a false breakout confirmed the correct entry point for buying the euro, but a major rally didn't follow, and trading remained around the 1.1336 level. The technical picture was revised for the second half of the day.

This image is no longer relevant

To Open Long Positions on EUR/USD:

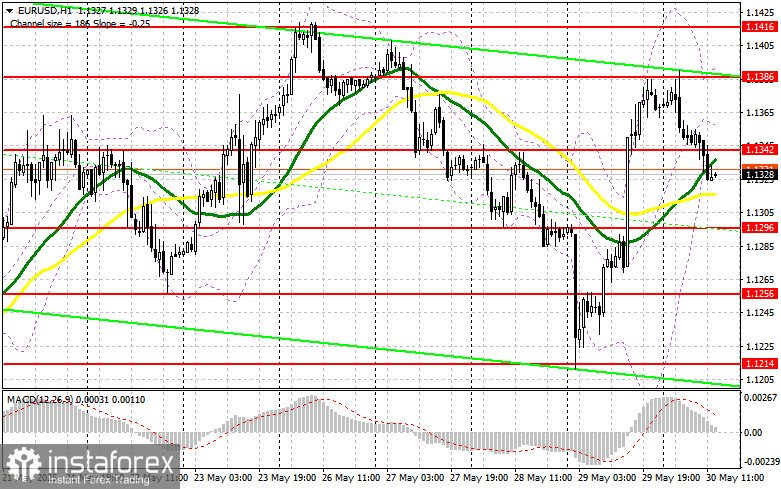
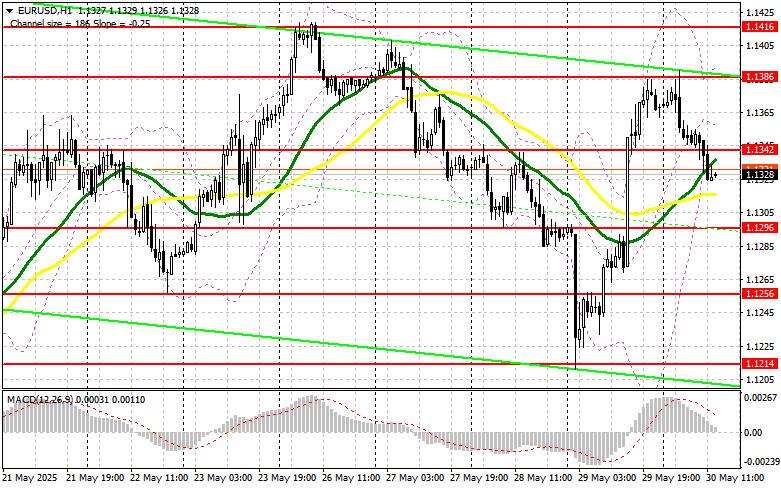
The euro fell in response to weak retail sales data from Germany, but good lending figures in the Eurozone limited the downside. In the second half of the day, an important report on the U.S. Core Personal Consumption Expenditures (PCE) Price Index will be released, which could shape the Fed's future stance on interest rates. We are also awaiting data on changes in U.S. income and spending levels, and the University of Michigan Consumer Sentiment Index. The day will conclude with a speech by FOMC member Raphael Bostic. In the case of a bearish market reaction—which seems more likely—focus will shift to defending the 1.1296 support. A false breakout there will provide an opportunity to buy EUR/USD, aiming for a recovery toward 1.1342. A breakout and retest of this range will confirm the correct entry point, with an exit around 1.1386. The furthest target will be 1.1416, where I plan to take profit. If EUR/USD declines and there is no activity around 1.1296 by the end of the week, pressure on the pair will intensify, leading to a deeper decline. In that case, bears could push the pair down to 1.1256. I would only look to buy after a false breakout there. Otherwise, I plan to open long positions immediately on a rebound from 1.1214, aiming for an intraday correction of 30–35 points.

To Open Short Positions on EUR/USD:

Euro sellers have asserted themselves and currently control the market. However, weak statistics may limit the pair's downward potential, so in case of a bullish reaction to the data, it's best to wait for a false breakout around the new resistance at 1.1342, where the moving averages are located. Only then would it make sense to enter short positions aiming for a decline toward 1.1296. A breakout and consolidation below this range would be a suitable setup for selling, with a target at 1.1256. The furthest target will be around 1.1214, where I will fix profits. If EUR/USD moves upward during the second half of the day and bears show no activity around 1.1342, buyers may achieve a larger rally and a renewal of 1.1386. I would only sell after a failed breakout there. Otherwise, I plan to open short positions immediately on a rebound from 1.1416, aiming for a downward correction of 30–35 points.

This image is no longer relevant

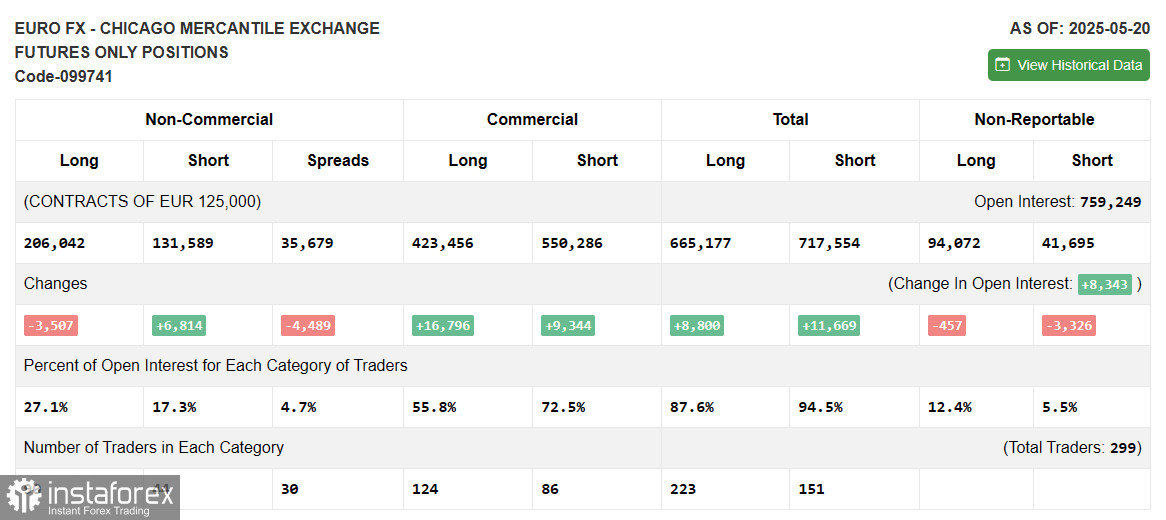
According to the COT (Commitments of Traders) report for May 20, there was an increase in short positions and a decrease in long positions. Given that the EU authorities are actively trying to reach a trade agreement with the U.S.—which even led to the postponement of higher tariffs until July—the chances of strengthening the euro are fairly good. Combined with the Fed's dovish stance, the chances for dollar growth are reduced. The COT report indicated that long non-commercial positions fell by 3,507 to 206,042, while short non-commercial positions rose by 6,814 to 131,589, narrowing the gap between longs and shorts by 4,489.

This image is no longer relevant

Indicator Signals:

Moving Averages: Trading is below the 30- and 50-day moving averages, indicating further downside for the pair.

Note: The periods and prices for the moving averages discussed here refer to the H1 chart and differ from the standard daily moving averages on the D1 chart.

Bollinger Bands: In the event of a decline, the lower boundary of the indicator around 1.1334 will act as support.

Indicator Descriptions:

  • Moving Average: Smooths volatility and noise to define the current trend. Period – 50 (yellow line on the chart).
  • Moving Average: Smooths volatility and noise to define the current trend. Period – 30 (green line on the chart).
  • MACD (Moving Average Convergence/Divergence): Fast EMA – 12; Slow EMA – 26; SMA – 9.
  • Bollinger Bands: Period – 20.
  • Non-commercial traders: Speculators such as individual traders, hedge funds, and large institutions using the futures market for speculative purposes under specific requirements.
  • Long non-commercial positions: The total number of open long positions held by non-commercial traders.
  • Short non-commercial positions: The total number of open short positions held by non-commercial traders.
  • Net non-commercial position: The difference between short and long positions held by non-commercial traders.
Miroslaw Bawulski,
انسٹافاریکس کا تجزیاتی ماہر
© 2007-2025
Summary
Urgency
Analytic
Maxim Magdalinin
Start trade
انسٹافاریکس کے ساتھ کرپٹو کرنسی کی معاملاتی تبدیلیوں سے کمائیں۔
میٹا ٹریڈر 4 ڈاؤن لوڈ کریں اور اپنی پہلی ٹریڈ کھولیں۔
  • Grand Choice
    Contest by
    InstaForex
    InstaForex always strives to help you
    fulfill your biggest dreams.
    مقابلہ میں شامل ہوں

تجویز کردہ مضامین

16 جولائی کو برطانوی پاؤنڈ/امریکی ڈالر پیئر کی تجارت کیسے کی جائے؟ نئے افراد کے لیے آسان تجاویز اور تجارتی تجزیہ

منگل کی تجارت کا تجزیہ برطانوی پاؤنڈ/امریکی ڈالر کا 1گھنٹے کا چارٹ امریکی افراط زر کی رپورٹ کے اجراء کے بعد منگل کو برطانوی پاؤنڈ/امریکی ڈالر جوڑا بھی گر گیا۔

Paolo Greco 14:22 2025-07-16 UTC+2

16 جولائی کو یورو/امریکی ڈالر کے جوڑے کی تجارت کیسے کی جائے؟ نئے افراد کے لیے آسان تجاویز اور تجارتی تجزیہ

منگل کی تجارت کا تجزیہ یورو/امریکی ڈالر کا 1گھنٹے کا چارٹ یو ایس افراط زر کی رپورٹ کے اجراء کے بعد منگل کو یورو/امریکی ڈالر کرنسی جوڑا تیزی

Paolo Greco 14:16 2025-07-16 UTC+2

16 جولائی کو برطانوی پاؤنڈ/امریکی ڈالر کے لیے تجارتی سفارشات اور تجارتی بریک ڈاؤن۔ مارکیٹ نے ایک اور رسمی عنصر کا استعمال کیا

برطانوی پاؤنڈ/امریکی ڈالر کا 5 منٹ کا تجزیہ منگل کو، برطانوی پاؤنڈ/امریکی ڈالر کرنسی جوڑے نے نیچے کی طرف حرکت جاری رکھی۔ اگرچہ امریکہ میں بنیادی افراط زر پیشن گوئی

Paolo Greco 13:57 2025-07-16 UTC+2

16 جولائی کو یورو/امریکی ڈالر کے لیے تجارتی سفارشات اور تجارتی خرابی۔

یورو/امریکی ڈالر کا 5 منٹ کا تجزیہ منگل کے بیشتر حصے میں، یورو/امریکی ڈالر کرنسی جوڑا کم سے کم اتار چڑھاؤ کے ساتھ تجارت کرتا رہا، ایک طرف حرکت کرتا

Paolo Greco 13:51 2025-07-16 UTC+2

15 جولائی کو برطانوی پاؤںڈ/امریکی ڈالر کے لیے تجارتی سفارشات اور تجارتی خرابی: برطانوی پاؤنڈ کمزوری ظاہر کرتا ہے

برطانوی پاؤںڈ/امریکی ڈالر کا 5 منٹ کا تجزیہ برطانوی پاؤںڈ/امریکی ڈالر کرنسی کے جوڑے نے پیر بھر میں نیچے کی طرف حرکت جاری رکھی۔ برطانیہ اور امریکہ دونوں میں میکرو

Paolo Greco 14:40 2025-07-15 UTC+2

15 جولائی کو یورو/امریکی ڈالر کے لیے تجارتی سفارشات اور تجارتی خرابی: یورو کلیدی سطح کے قریب پھنس گیا

یورو/امریکی ڈالر 5 منٹ کا تجزیہ یورو/امریکی ڈالر کرنسی کا جوڑا پیر بھر میں ایک طرف چلا گیا۔ ہمارے پچھلے مضمون میں، ہم نے اندازہ لگایا تھا کہ ہفتے

Paolo Greco 14:34 2025-07-15 UTC+2

14 جولائی کو برطانوی پاؤنڈ/امریکی ڈالر کے لیے تجارتی سفارشات اور تجارتی بریک ڈاؤن۔ برطانوی پاؤنڈ نے مندی کا تعصب برقرار رکھا

برطانوی پاؤنڈ/امریکی ڈالر 5 منٹ کا تجزیہ برطانوی پاؤنڈ/امریکی ڈالر کرنسی کے جوڑے نے جمعہ بھر میں نیچے کی طرف حرکت جاری رکھی۔ ہم یہ نہیں کہہ سکتے

Paolo Greco 14:32 2025-07-14 UTC+2

14 جولائی کو یورو/امریکی ڈالر کے لیے تجارتی سفارشات اور تجارتی بریک ڈاؤن۔ ڈالر تھکا ہوا ہے

یورو/امریکی ڈالر کا 5 منٹ کا تجزیہ یورو/امریکی ڈالر کرنسی کے جوڑے نے جمعہ بھر میں عملی طور پر کوئی کمی نہیں دکھائی۔ جیسا کہ ہم نے پچھلے مضمون

Paolo Greco 14:27 2025-07-14 UTC+2

11 جولائی کو برطانوی پاؤنڈ/امریکی ڈالر کی تجارت کیسے کی جائے؟ نئے افراد کے لیے آسان تجاویز اور تجارتی تجزیہ

جمعرات کا تجارتی جائزہ: برطانوی پاؤنڈ/امریکی ڈالر کا 1گھنٹے کا چارٹ جمعرات کو، برطانوی پاؤنڈ/امریکی ڈالر جوڑے نے اپنی نیچے کی طرف حرکت جاری رکھی، یورو/امریکی ڈالر کی جوڑی

Paolo Greco 10:30 2025-07-11 UTC+2

11 جولائی کو یورو/امریکی ڈالر کی تجارت کیسے کریں؟ نئے افراد کے لیے آسان تجاویز اور تجارتی جائزہ

یورو/امریکی ڈالر کا 1 گھنٹے کا چارٹ جمعرات کا تجارتی جائزہ جمعرات کو، یورو/امریکی ڈالر کرنسی کے جوڑے نے موجودہ رجحان کے مطابق اپنی کمزور نیچے کی حرکت کو جاری

Paolo Greco 10:30 2025-07-11 UTC+2
ابھی فوری بات نہیں کرسکتے ؟
اپنا سوال پوچھیں بذریعہ چیٹ.
Widget callback
 

Dear visitor,

Your IP address shows that you are currently located in the USA. If you are a resident of the United States, you are prohibited from using the services of InstaFintech Group including online trading, online transfers, deposit/withdrawal of funds, etc.

If you think you are seeing this message by mistake and your location is not the US, kindly proceed to the website. Otherwise, you must leave the website in order to comply with government restrictions.

Why does your IP address show your location as the USA?

  • - you are using a VPN provided by a hosting company based in the United States;
  • - your IP does not have proper WHOIS records;
  • - an error occurred in the WHOIS geolocation database.

Please confirm whether you are a US resident or not by clicking the relevant button below. If you choose the wrong option, being a US resident, you will not be able to open an account with InstaForex anyway.

We are sorry for any inconvenience caused by this message.