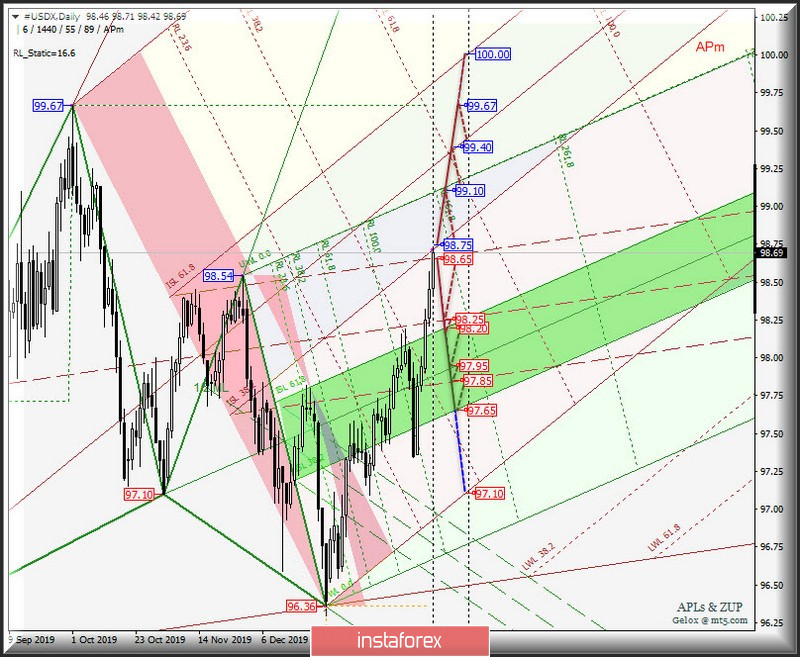
US dollar index
The dollar index #USDX will determine the development of its movement from February 10, 2020, depending on the breakdown direction of a quite narrow range: resistance level of 98.75 - lower boundary of the ISL38.2 equilibrium zone of the Minor operational scale forks;
- resistance level of 98.75;
- support level of 98.65 - the upper boundary of the 1/2 Median Line Minor channel.
The breakdown of ISL38.2 Minor - resistance level of 98.75 - will make the development of #USDX movement in the equilibrium zone (98.75 - 99.40 - 100.00)of the Minor operational scale forks relevant.
On the other hand, the breakdown of the support level of 98.65 - the development of the dollar index movement will continue within the 1/2 Median Line channel (98.65 - 98.25 - 97.85) of the Minor operational scale forks and the equilibrium zone (98.20 - 97.95 - 97.65) of the Minuette operational scale forks.
The markup of #USDX movement options from February 10, 2020 is shown on the animated chart.
____________________
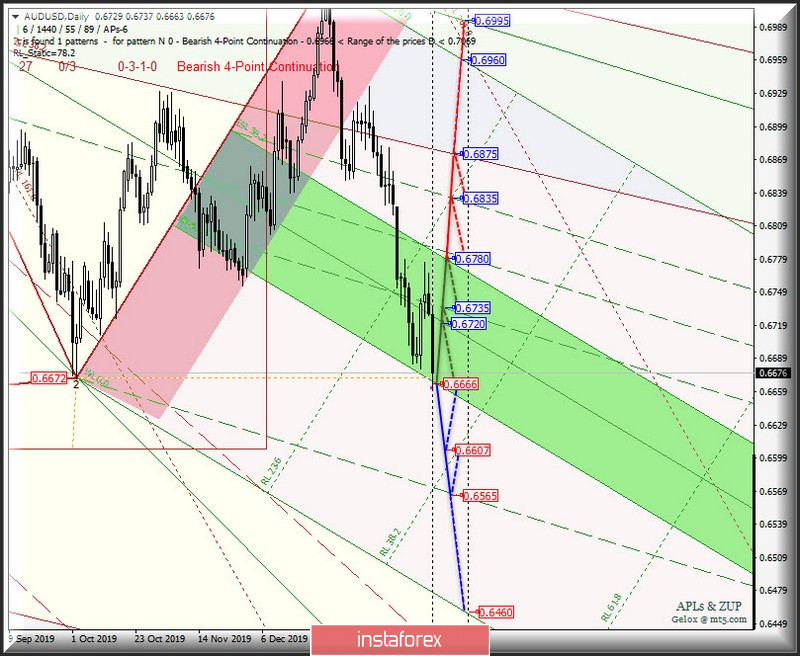
Australian dollar vs US dollar
The movement of the Australian dollar AUD/USD from February 10, 2020 will be determined by developing the boundaries of the equilibrium zone (0.6666 - 0.6720 - 0.6780) of the Minuette operational scale forks. We look at the animated chart for the details.
The breakdown of the lower boundary of the JSL61.8 equilibrium zone of the Minuette operational scale forks - support level of 0.6666 - will lead to the continuation of the downward movement of the Australian dollar towards the targets:
- local minimum 0.6607 ;
-ultimate Shiff Line Minuette (0.6565).
On the contrary, the breakdown of the resistance level of 0.6780 at the upper boundary of the ISL38.2 equilibrium zone of the Minuette operational scale forks - an option for the development of the upward movement of AUD / USD to the targets:
- upper boundary of the 1/2 Median Line Minuette channel; (0.6835);
- the lower boundary of ISL38.2 (0.6875) equilibrium zone of the Minor operational scale forks.
We look at the layout of the AUD / USD movement options from February 10, 2020 on the animated chart.
____________________
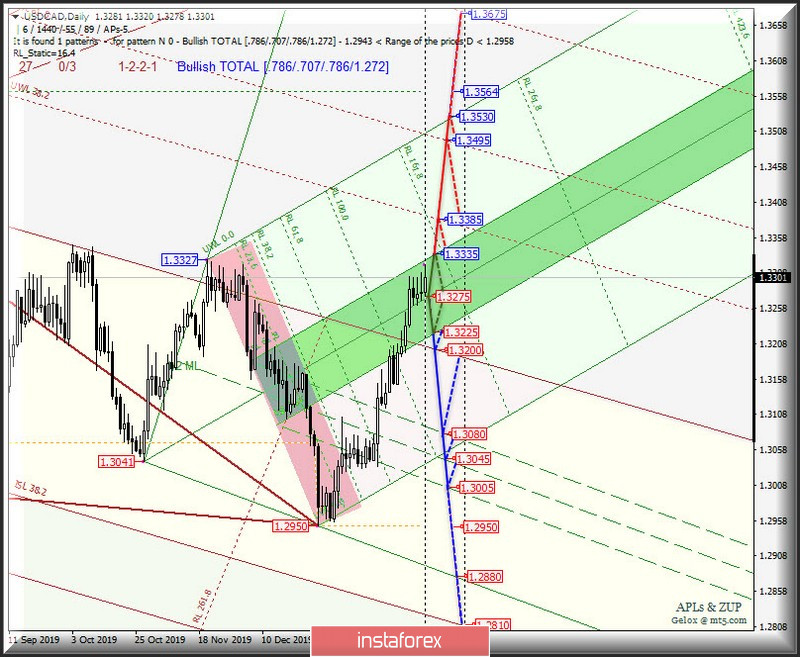
US dollar vs Canadian dollar
The development of the movement of the Canadian dollar USD / CAD from February 10, 2020 will also depend on the development and direction of the breakdown of the boundaries of the equilibrium zone (1.3225 - 1.3275 - 1.3335) of the Minuette operational scale forks. The markup of movement inside this equilibrium zone is presented on an animated chart.
In case of breakdown of the upper boundary of ISL61.8 (resistance level of 1.3335) of the equilibrium zone of the Minuette operational scale forks, it will be possible to continue the upward movement of USD / CAD to the warning UWL38.2 (1.3385) and UWL62.8 (1.3495) to the lines of the Minor operational scale forks with the prospect of reaching the final line FSL Minuette (1.3530).
Meanwhile, in case of successive breakdown of the lower boundary of ISL38.2 (support level of 1.3225) of the equilibrium zone of the Minuette operational scale forks and the initial SSL line (1.3200) of the Minor operational scale forks, the downward movement of the Canadian dollar can continue to the boundaries of 1/2 Median Line Minuette channel (1.3080 - 1.3045 - 1.3005).
We look at the markup of the USD / CAD movement options from February 10, 2020 on the animated chart.
____________________
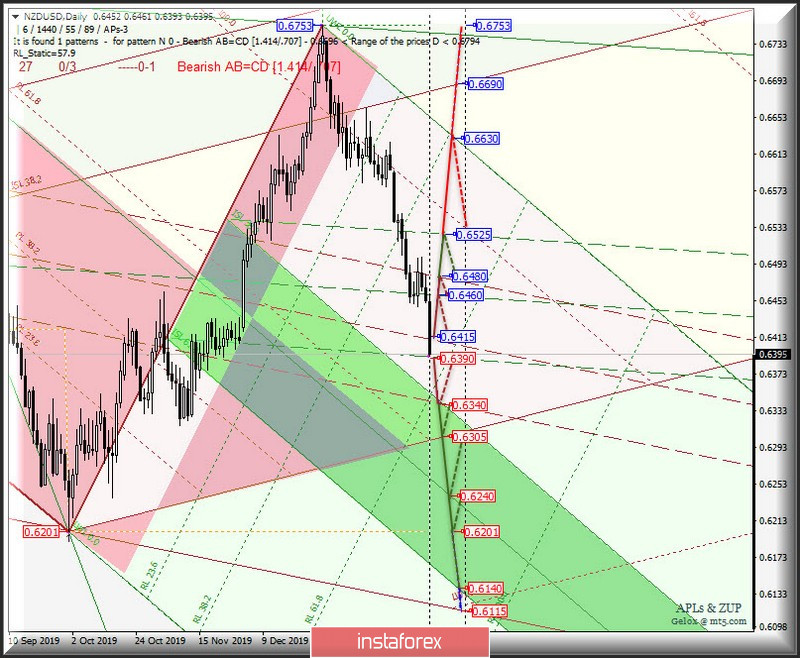
New Zealand dollar vs US dollar
The development and the breakdown direction of the range :
- resistance level of 0.6415 (1/2 Median Line Minor);
- support level ofl 0.6390 (lower boundary of the 1/2 Median Line Minuette channel).
The breakdown of the lower boundary of the 1/2 Median Line Minuette channel - support level of 0.6390 - will lead to the continuation of the development of the downward movement of the New Zealand dollar to the boundaries of the equilibrium zone (0.6340 - 0.6240 - 0.6140) of the Minuette operational scale forks.
Alternatively, the breakdown of 1/2 Median Line Minor - resistance level of 0.6415 - it will be possible to develop an upward movement of NZD / USD to the goals:
- 1/2 Median Line Minuette (0.6460);
- the upper boundary of the 1/2 Median Line Minor channel (0.6480);
- the upper boundary of the 1/2 Median Line Minuette channel (0.6525);
with the prospect of reaching the initial SSL line (0.6630) of the Minuette operational scale forks.
We look at the layout of the NZD / USD movement options from February 10, 2020 on the animated chart.
____________________
The review is made without taking into account the news background. Thus, the opening of trading sessions of major financial centers does not serve as a guide to action (placing orders "sell" or "buy").
The formula for calculating the dollar index:
USDX = 50.14348112 * USDEUR0.576 * USDJPY0.136 * USDGBP0.119 * USDCAD0.091 * USDSEK0.042 * USDCHF0.036.
where the power coefficients correspond to the weights of the currencies in the basket:
Euro - 57.6%;
Yen - 13.6%;
Pound Sterling - 11.9%;
Canadian dollar - 9.1%;
Swedish krona - 4.2%;
Swiss franc - 3.6%.
The first coefficient in the formula leads the index to 100 at the starting date - March 1973, when the main currencies began to be freely quoted relative to each other.