empty
26.06.2025 06:53 PM
EUR/USD: Trading Plan for the U.S. Session on June 26th (Morning Trade Review)

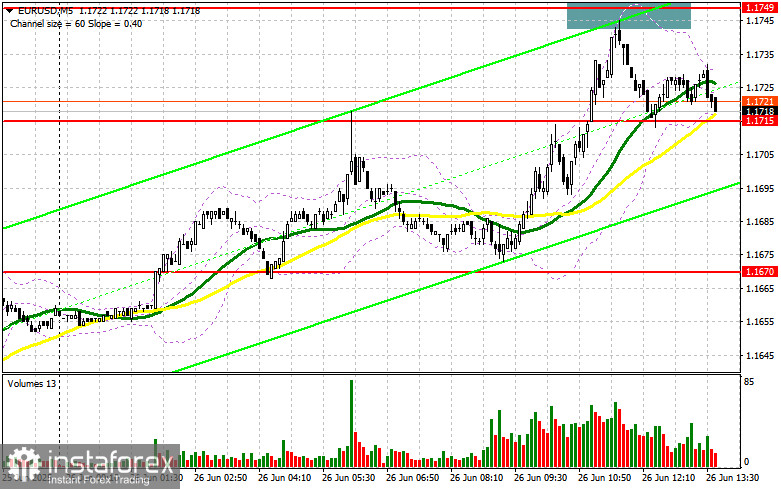
In my morning forecast, I focused on the 1.1749 level and planned to make trading decisions based on it. Let's look at the 5-minute chart and analyze what happened. Although the pair moved higher, it never reached this range, so I didn't enter any trades. The technical outlook was revised for the second half of the day.

This image is no longer relevant

To open long positions on EUR/USD:

Yesterday's bullish momentum, triggered by Trump's criticism of Powell, persisted in the first half of the day. The absence of significant data from the eurozone helped EUR/USD extend gains. Today's second half of the day is packed with U.S. statistics. It starts with the final GDP data for Q1 and the Core PCE Price Index, followed by weekly jobless claims and durable goods orders. FOMC members Thomas Barkin and Michael S. Barr are also scheduled to speak, which may attract additional attention.

If the pair declines after the data—keep in mind that the euro is strongly overbought—I will only act around the new support at 1.1709. A false breakout at that level will be a signal to buy EUR/USD in anticipation of a rebound and a retest of the 1.1749 resistance, which fell just short of being reached earlier in the day. A breakout and retest of this range would confirm the correct entry point, opening the way to 1.1775. The ultimate target would be 1.1806, where I would take profit.

If EUR/USD declines and there's no buying interest around 1.1709, pressure on the pair will increase significantly, likely leading to a deeper drop. In that case, bears could push the pair toward 1.1670. Only after a false breakout form will I consider buying the euro. Otherwise, I will open long positions on a rebound from 1.1630, aiming for a 30–35 point intraday upward correction.

To open short positions on EUR/USD:

Sellers made their presence felt after the pair updated its monthly high, but the movement so far remains a correction. Only very strong U.S. data could restore pressure on the pair. If the data disappoints, further euro growth is likely. In that case, a false breakout at 1.1749 will be a signal to open short positions with a target at 1.1709. A breakout and consolidation below that range would be an opportunity to sell, with the next target near 1.1670, where the moving averages—currently supporting bulls—are located. The ultimate downward target is 1.1630, where I would take profit.

If EUR/USD rises again in the second half of the day and there is no strong bearish activity around 1.1749, buyers may push the market higher and update 1.1775. I would only consider short positions there after a failed breakout. Alternatively, I will open short positions on a rebound from 1.1806, targeting a 30–35 point downward correction.

This image is no longer relevant

COT Report (Commitment of Traders) – June 17

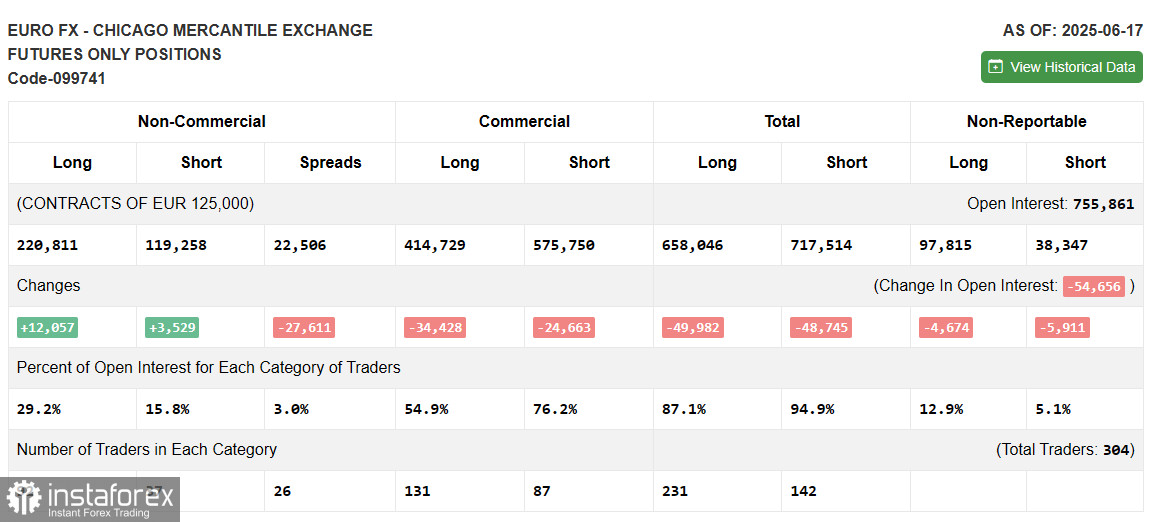
The latest COT report showed an increase in both long and short positions. The Fed's decision to leave rates unchanged positively affected the dollar's position, but the primary driver of growth remained the conflict in the Middle East. Upcoming data on U.S. economic growth could influence the Fed's plans, which in turn will determine the future direction of EUR/USD.

According to the COT report, non-commercial long positions rose by 12,057 to 220,811, while non-commercial short positions increased by 3,529 to 119,258. As a result, the gap between long and short positions narrowed by 27,611.

This image is no longer relevant

Indicator Signals:

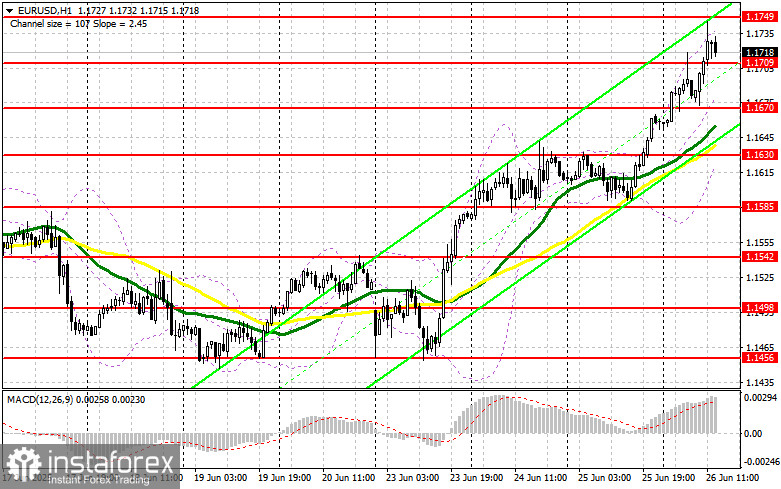
Moving AveragesTrading is taking place above the 30- and 50-day moving averages, indicating further euro strength.Note: The author uses H1 (hourly) chart settings, which differ from traditional daily (D1) moving average interpretations.

Bollinger Bands In the event of a decline, the lower band around 1.1630 will act as support.

Indicator Descriptions:

  • Moving Average (MA): Identifies the current trend by smoothing out price fluctuations and noise. Period – 50 (yellow line on the chart).
  • Moving Average (MA): Period – 30 (green line on the chart).
  • MACD (Moving Average Convergence/Divergence): Fast EMA – 12; Slow EMA – 26; SMA – 9.
  • Bollinger Bands: Period – 20.
  • Non-commercial traders: Speculators such as retail traders, hedge funds, and large institutions using the futures market for speculative purposes.
  • Long non-commercial positions: Total long open positions held by non-commercial traders.
  • Short non-commercial positions: Total short open positions held by non-commercial traders.
  • Net non-commercial position: The difference between short and long positions among non-commercial traders.
Miroslaw Bawulski,
Analytical expert of InstaForex
© 2007-2025
Select timeframe
5
min
15
min
30
min
1
hour
4
hours
1
day
1
week
Earn on cryptocurrency rate changes with InstaForex
Download MetaTrader 4 and open your first trade
  • Grand Choice
    Contest by
    InstaForex
    InstaForex always strives to help you
    fulfill your biggest dreams.
    JOIN CONTEST

Recommended Stories

GBP/USD: Trading Plan for the U.S. Session on July 7th (Review of Morning Trades)

In my morning forecast, I highlighted the 1.3602 level and planned to use it to determine entry points into the market. Let's look at the 5-minute chart and analyze what

Miroslaw Bawulski 13:21 2025-07-07 UTC+2

EUR/USD: Trading Plan for the U.S. Session on July 7th (Review of the Morning Trades)

In my morning forecast, I highlighted the 1.1749 level and planned to base market entry decisions around it. Let's look at the 5-minute chart and break down what happened

Miroslaw Bawulski 13:20 2025-07-07 UTC+2

How to Trade the GBP/USD Currency Pair on July 7th? Simple Tips and Trade Review for Beginners

On Friday, the GBP/USD pair showed total flat movement and low volatility. As with the EUR/USD pair, there was no news that day, and no macroeconomic publications were released either

Paolo Greco 07:48 2025-07-07 UTC+2

How to Trade the EUR/USD Currency Pair on July 7th: Simple Tips and Trade Analysis for Beginners

Friday Trade Analysis: EUR/USD 1H Chart The EUR/USD pair stayed flat all day Friday, with volatility totaling 36 points, clearly indicating a lack of trading activity. This is not surprising

Paolo Greco 07:32 2025-07-07 UTC+2

GBP/USD Trading Recommendations and Trade Analysis for July 7th

The GBP/USD currency pair traded with low volatility and primarily moved sideways. As mentioned earlier, last week was particularly interesting in how the market interpreted various events and publications

Paolo Greco 07:11 2025-07-07 UTC+2

EUR/USD Trading Recommendations and Trade Analysis for July 7th

The EUR/USD currency pair did not exhibit any notable movements on Friday—or any movements at all. Friday was Independence Day in the United States, effectively making it a non-trading

Paolo Greco 07:03 2025-07-07 UTC+2

GBP/USD: Trading Plan for the U.S. Session on July 4th (Review of Morning Trades)

In my morning forecast, I highlighted the 1.3672 level as a key decision point for entering the market. Let's look at the 5-minute chart and analyze what happened. A rise

Miroslaw Bawulski 18:20 2025-07-04 UTC+2

EUR/USD: Trading Plan for the U.S. Session on July 4th (Review of Morning Trades)

In my morning forecast, I highlighted the 1.1787 level as a key point for making trading decisions. Let's look at the 5-minute chart to analyze what happened. A rise

Miroslaw Bawulski 18:16 2025-07-04 UTC+2

How to Trade the GBP/USD Pair on July 4? Simple Tips and Trade Analysis for Beginners

Analysis of Thursday's Trades 1H Chart of GBP/USD On Thursday, the GBP/USD pair once again plummeted, but this time the drop in the British currency lasted only five minutes

Paolo Greco 07:16 2025-07-04 UTC+2

How to Trade the EUR/USD Pair on July 4? Simple Tips and Trade Analysis for Beginners

Analysis of Thursday's Trades 1H Chart of EUR/USD The EUR/USD currency pair traded throughout Thursday, both before and after the publication of the U.S. Nonfarm Payrolls and unemployment data

Paolo Greco 06:34 2025-07-04 UTC+2
Can't speak right now?
Ask your question in the chat.
Widget callback
 

Dear visitor,

Your IP address shows that you are currently located in the USA. If you are a resident of the United States, you are prohibited from using the services of InstaFintech Group including online trading, online transfers, deposit/withdrawal of funds, etc.

If you think you are seeing this message by mistake and your location is not the US, kindly proceed to the website. Otherwise, you must leave the website in order to comply with government restrictions.

Why does your IP address show your location as the USA?

  • - you are using a VPN provided by a hosting company based in the United States;
  • - your IP does not have proper WHOIS records;
  • - an error occurred in the WHOIS geolocation database.

Please confirm whether you are a US resident or not by clicking the relevant button below. If you choose the wrong option, being a US resident, you will not be able to open an account with InstaForex anyway.

We are sorry for any inconvenience caused by this message.