empty
23.06.2025 04:56 AM
Oil Forecast for June 23, 2025

Crude Oil (CL)

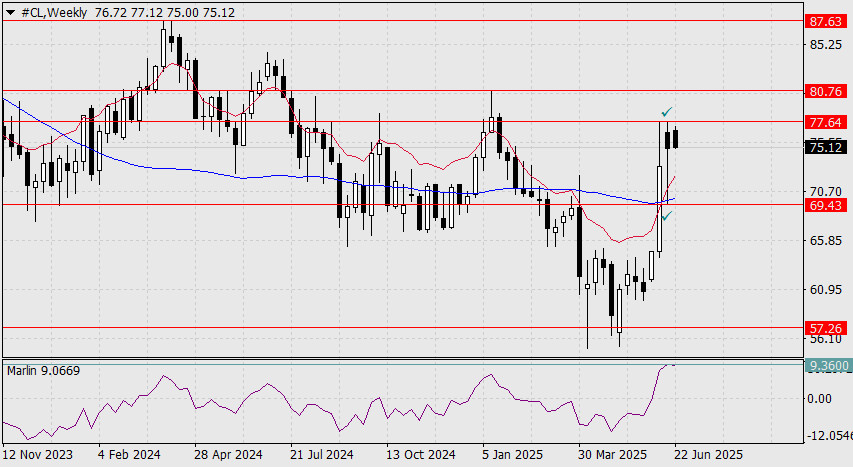
On the weekly chart, the signal line of the Marlin oscillator has begun to reverse from the 9.3600 level. Historically, this level has marked significant downward reversals—in April 2023, October 2021, and April 2019. Breakouts above this level have varied: some were strong (e.g., August 2023, February 2022), while others were weak and merely noise.

This image is no longer relevant

The current situation indicates the price is at a crossroads: continued geopolitical tension could drive further price increases, while declining global demand may lead to a reversal.

A consolidation above last week's high at 77.64 would support a geopolitically driven upward move. A decline below last week's low at 69.43, which would also mean a break below the MACD line support, would signal the start of a bearish scenario. Both scenarios are equally probable. Growth targets: 80.76 – high in January, 87.63 – high in April 2024. Downside target: 57.26 – low in March 2021.

This image is no longer relevant

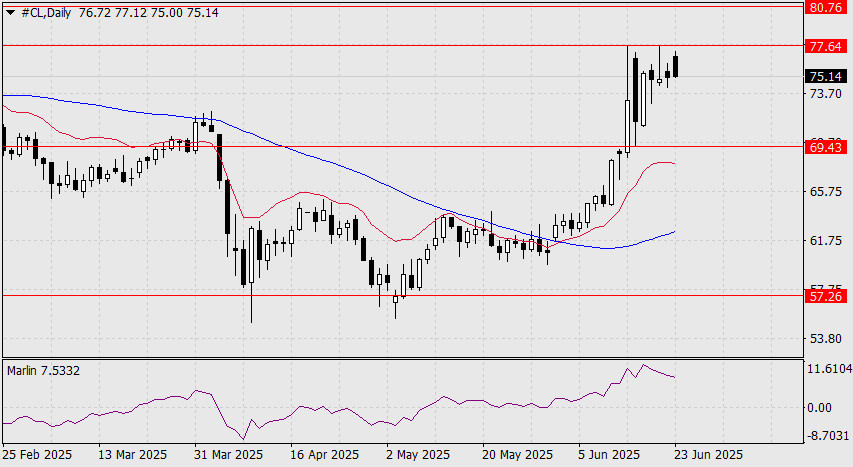
In the daily timeframe, the Marlin oscillator has entered the overbought zone. The last stronger impulse was in March 2022, when the price surged to 130.44. However, the current sharp reversal of the oscillator from the oversold zone may indicate a discharge before further growth.

Thus, key indicators for price movement are a breakout and consolidation above 77.64 or a drop and consolidation below 69.43.

This image is no longer relevant

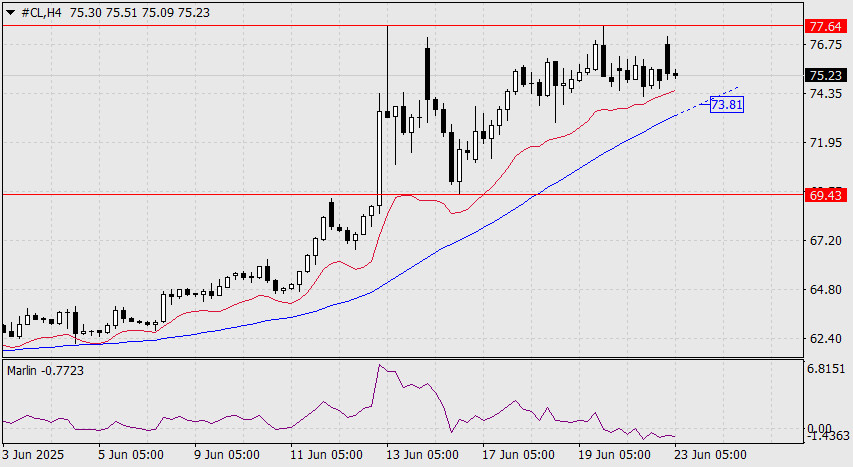
A primary signal of a downward reversal could be the price consolidating below the MACD line at 73.81 on the H4 chart.

Laurie Bailey,
Analytical expert of InstaForex
© 2007-2025
Select timeframe
5
min
15
min
30
min
1
hour
4
hours
1
day
1
week
Earn on cryptocurrency rate changes with InstaForex
Download MetaTrader 4 and open your first trade
  • Grand Choice
    Contest by
    InstaForex
    InstaForex always strives to help you
    fulfill your biggest dreams.
    JOIN CONTEST

Recommended Stories

NZD/USD. Analysis, Forecast, and Current Market Situation

The NZD/USD pair is currently trading above the psychological level of 0.6000; however, it remains vulnerable to further downside amid broad-based U.S. dollar strength. The U.S. Dollar Index is supported

Irina Yanina 12:00 2025-07-09 UTC+2

Forecast for EUR/USD on July 9, 2025

On Tuesday, the EUR/USD pair continued to decline, completely ignoring the 127.2% correction level at 1.1712. This level is currently not suitable for identifying trading signals. The euro's decline should

Samir Klishi 11:20 2025-07-09 UTC+2

Forecast for GBP/USD on July 9, 2025

On the hourly chart, the GBP/USD pair fell on Tuesday to the 127.2% Fibonacci level at 1.3527, rebounded from it, and turned in favor of the pound. This may signal

Samir Klishi 11:05 2025-07-09 UTC+2

Can 0.7939 withstand the temporary correction of the USD/CHF currency pair, Wednesday, July 9, 2025?

USD/CHF – Wednesday, July 9, 2025. Due to the USD's safe-haven support and global trade risks, although the CHF is quite strong, these conditions still have the potential to cause

Arief Makmur 07:12 2025-07-09 UTC+2

Sellers continue to dominate the NZD/USD commodity currency pair, Wednesday, July 9, 2025.

NZD/USD, Wednesday, July 9, 2025. Global risk sentiment regarding commodity currencies and New Zealand's cautious monetary outlook are putting pressure on the Kiwi's potential today. Key Levels 1. Resistance

Arief Makmur 07:12 2025-07-09 UTC+2

EUR/USD Forecast for July 9, 2025

On Tuesday, the euro attempted a downward move but failed to reach support at the MACD line, stopping at the target level of 1.1692. The day closed with a white

Laurie Bailey 06:58 2025-07-09 UTC+2

GBP/USD Forecast for July 9, 2025

Yesterday, the British pound tested the area around the daily balance line. This move revealed the weakness of support levels on the path toward the target level of 1.3414, which

Laurie Bailey 06:30 2025-07-09 UTC+2

USD/JPY Forecast for July 9, 2025

USD/JPYThe USD/JPY pair appears to be completing the formation of a triangle. There are several possible scenarios. According to the main scenario, the pair is likely to test the upper

Laurie Bailey 06:25 2025-07-09 UTC+2

Trading Signals for EUR/USD for July 8-12, 2025: buy above 1.1650 (21 SMA - 8/8 Murray)

The eagle indicator has reached oversold levels, so we believe the euro could recover above 1.1680 in the coming hours and then reach 1.1718, where the 8/8 Murray is located

Dimitrios Zappas 18:58 2025-07-08 UTC+2

Trading Signals for GOLD (XAU/USD) for July 8-12, 2025: buy above $3,285 (21 SMA - 4/8 Murray)

If a break below 3,281 occurs, we could expect a bearish acceleration, and gold could reach the 3/8 Murray level at 3,242 and ultimately reach the bottom of the main

Dimitrios Zappas 18:56 2025-07-08 UTC+2
Can't speak right now?
Ask your question in the chat.
Widget callback
 

Dear visitor,

Your IP address shows that you are currently located in the USA. If you are a resident of the United States, you are prohibited from using the services of InstaFintech Group including online trading, online transfers, deposit/withdrawal of funds, etc.

If you think you are seeing this message by mistake and your location is not the US, kindly proceed to the website. Otherwise, you must leave the website in order to comply with government restrictions.

Why does your IP address show your location as the USA?

  • - you are using a VPN provided by a hosting company based in the United States;
  • - your IP does not have proper WHOIS records;
  • - an error occurred in the WHOIS geolocation database.

Please confirm whether you are a US resident or not by clicking the relevant button below. If you choose the wrong option, being a US resident, you will not be able to open an account with InstaForex anyway.

We are sorry for any inconvenience caused by this message.